
- The IRS released the 2027 federal tax brackets on November 5, 2026. The 10% bracket now covers the first $12,800 of taxable income for single filers and $25,600 for married couples filing jointly.
- The 2026 brackets apply to the tax return you file in early 2027, while the 2027 brackets apply to income you earn next year.
- The seven rates stay at 10%, 12%, 22%, 24%, 32%, 35% and 37%, and the 2027 standard deduction rises to $16,600 for single filers and $33,200 for married couples.
Federal income tax brackets set how much of each slice of your taxable income goes to the IRS. The IRS adjusts the income ranges for inflation every year, and it released the 2027 tax brackets and standard deduction on November 5, 2026. Below you’ll find the 2027 and 2026 IRS tax tables for every filing status, plus standard deduction amounts and brackets going back to 2018.
Use the 2026 brackets for the return you file between January and April 2027, and the 2027 brackets to plan your withholding and income for next year. To see federal, state and local taxes together, run your numbers in our income tax calculator. Investors can find the separate rates for stock and fund sales in our capital gains tax brackets.
Would you like to save this?
What Are The 2027 Federal Tax Brackets?
The 2027 federal tax brackets keep the same seven tax bracket rates, from 10% to 37%, with income ranges about 3.2% higher than in 2026. These brackets apply to income you earn from January 1 through December 31, 2027, and you’ll use them on the return you file in 2028. The figures come from IRS Revenue Procedure 2026-35 (PDF File).
| Tax Rate | Single | Married Filing Jointly | Head Of Household | Married Filing Separately |
|---|---|---|---|---|
| 10% | $0 – $12,800 | $0 – $25,600 | $0 – $18,250 | $0 – $12,800 |
| 12% | $12,801 – $52,025 | $25,601 – $104,050 | $18,251 – $69,650 | $12,801 – $52,025 |
| 22% | $52,026 – $109,125 | $104,051 – $218,250 | $69,651 – $109,100 | $52,026 – $109,125 |
| 24% | $109,126 – $208,325 | $218,251 – $416,650 | $109,101 – $208,300 | $109,126 – $208,325 |
| 32% | $208,326 – $264,550 | $416,651 – $529,100 | $208,301 – $264,550 | $208,326 – $264,550 |
| 35% | $264,551 – $661,375 | $529,101 – $793,650 | $264,551 – $661,350 | $264,551 – $396,825 |
| 37% | $661,376+ | $793,651+ | $661,351+ | $396,826+ |
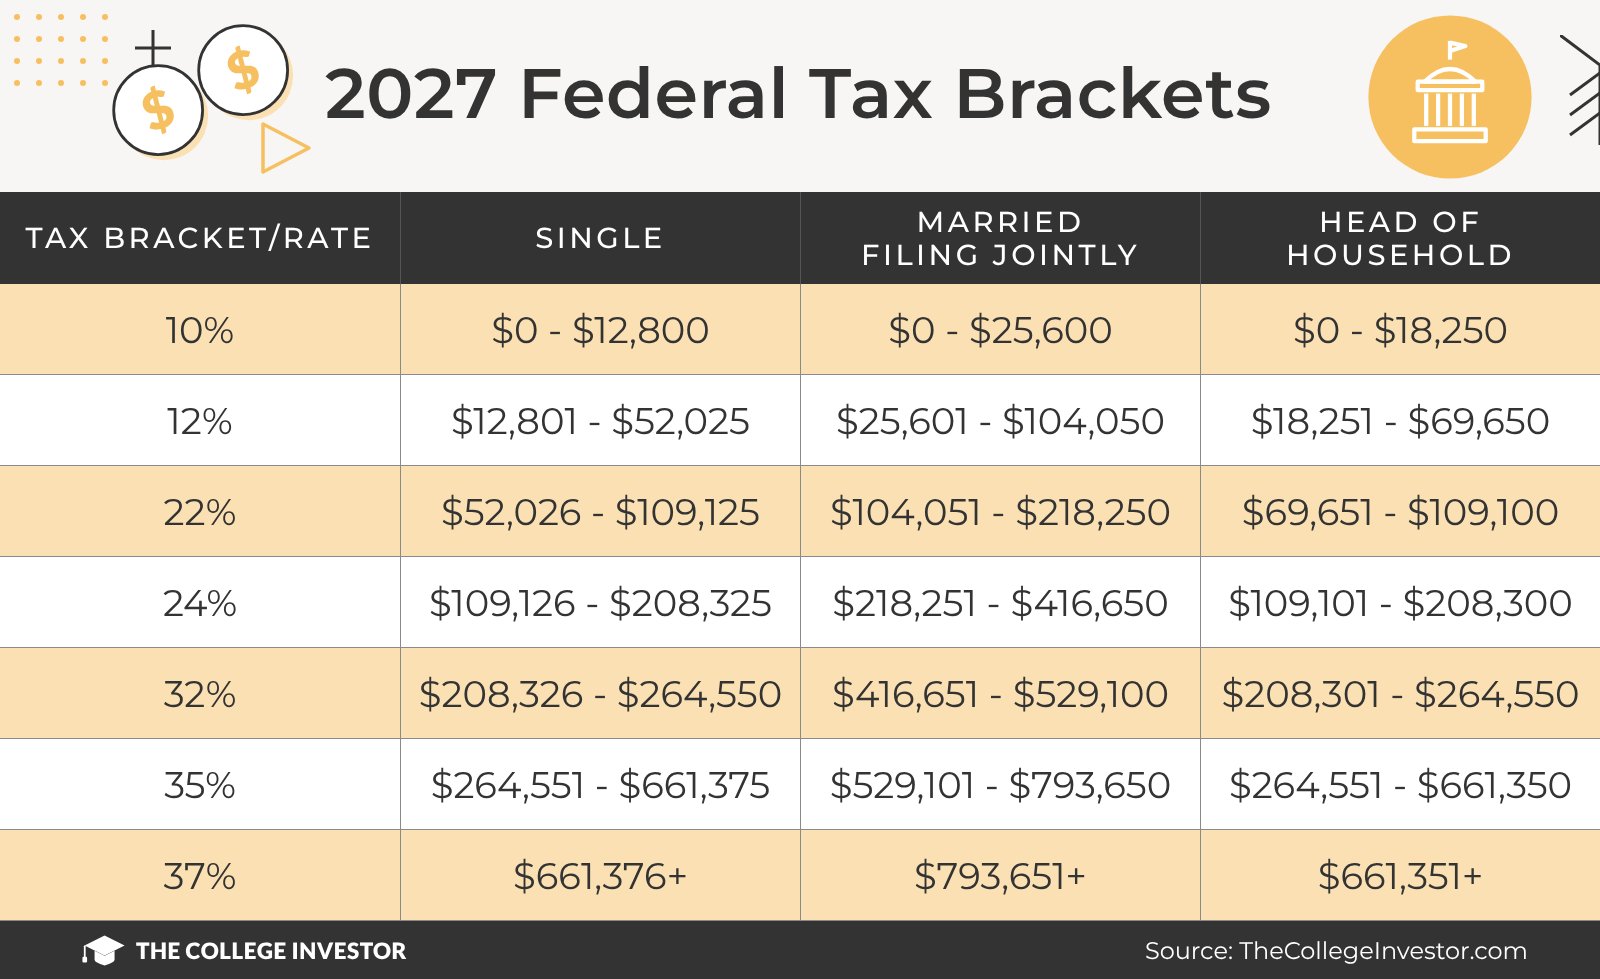
The top 37% rate applies to taxable income above $661,375 for single filers, $793,650 for married couples filing jointly and $661,350 for heads of household. Married couples filing separately reach 37% at $396,825, about half the joint threshold. Our breakdown of the marriage tax penalty explains why the top bracket doesn’t double for couples.
What Are The 2026 Federal Tax Brackets?
The 2026 federal tax brackets apply to income earned from January 1 through December 31, 2026. These are the brackets you’ll use on the tax return due April 15, 2027, whether you file your own taxes or use a preparer.
| Tax Rate | Single | Married Filing Jointly | Head Of Household | Married Filing Separately |
|---|---|---|---|---|
| 10% | $0 – $12,400 | $0 – $24,800 | $0 – $17,700 | $0 – $12,400 |
| 12% | $12,401 – $50,400 | $24,801 – $100,800 | $17,701 – $67,450 | $12,401 – $50,400 |
| 22% | $50,401 – $105,700 | $100,801 – $211,400 | $67,451 – $105,700 | $50,401 – $105,700 |
| 24% | $105,701 – $201,775 | $211,401 – $403,550 | $105,701 – $201,750 | $105,701 – $201,775 |
| 32% | $201,776 – $256,225 | $403,551 – $512,450 | $201,751 – $256,200 | $201,776 – $256,225 |
| 35% | $256,226 – $640,600 | $512,451 – $768,700 | $256,201 – $640,600 | $256,226 – $384,350 |
| 37% | $640,601+ | $768,701+ | $640,601+ | $384,351+ |

The 2026 ranges rose with inflation, and the One Big Beautiful Bill Act, signed July 4, 2025, made the seven rates permanent. Before that law, the rates were set to rise after 2025. Our list of the best tax breaks available today covers the other changes from the law.
Filing Your 2026 Return?
Tax software applies the right brackets for you once you enter your income. Compare options in our best tax software rankings and TurboTax review, or see whether you qualify for free tax software.
What Are Tax Brackets And How Do They Work?
Tax brackets are income ranges taxed at set rates, and they’re marginal, so each rate applies only to the income inside its range. Moving into a higher bracket never raises the tax on the income below it. Our explanation of what happens when you move into a higher tax bracket walks through more examples.
Here’s how a single filer earning $75,000 in wages would figure 2027 federal income tax with the $16,600 standard deduction. The same steps work for any income, and the income tax calculator runs them for you.
| Step | Amount |
|---|---|
| Wages | $75,000 |
| Standard Deduction | -$16,600 |
| Taxable Income | $58,400 |
| 10% On The First $12,800 | $1,280.00 |
| 12% On The Next $39,225 | $4,707.00 |
| 22% On The Last $6,375 | $1,402.50 |
| Federal Income Tax | $7,389.50 |
That filer is in the 22% bracket, but the tax equals about 9.9% of wages, which is the effective tax rate. The same filer would owe $7,670 under the 2026 brackets, so the 2027 adjustment saves $280.50 at the same pay.
How Do I Find My Tax Bracket?
Your tax bracket depends on your taxable income and filing status, not your salary. Taxable income is what’s left after pre-tax contributions and your standard or itemized deduction.
- Add up your wages, interest and other income for the year.
- Subtract pre-tax retirement, HSA and other adjustments to get adjusted gross income.
- Deduct the standard deduction ($16,600 single or $33,200 married filing jointly in 2027) or your itemized deductions.
- Match your taxable income to a row in the bracket table above.
A single filer lands in the 22% bracket in 2027 with taxable income between $52,026 and $109,125. A married couple filing jointly lands there between $104,051 and $218,250. Pre-tax 401(k) and HSA contributions lower your adjusted gross income, which cuts tax at your top rate.
What Is The Standard Deduction For 2026 And 2027?
The 2027 standard deduction is $16,600 for single filers and married couples filing separately, $33,200 for married couples filing jointly and $24,925 for heads of household. For 2026, the amounts are $16,100, $32,200 and $24,150. Most filers take the standard deduction because it beats their itemized deductions.
| Filing Status | 2025 | 2026 | 2027 |
|---|---|---|---|
| Single | $15,750 | $16,100 | $16,600 |
| Married Filing Jointly | $31,500 | $32,200 | $33,200 |
| Head Of Household | $23,625 | $24,150 | $24,925 |
| Married Filing Separately | $15,750 | $16,100 | $16,600 |
Filers who are 65 or older or blind add $1,700 each in 2027 if married, or $2,100 if unmarried, up from $1,650 and $2,050 in 2026. Filers 65 and older can also claim a separate $6,000 senior deduction through 2028, which our roundup of the top tax breaks explains.
Prior Year Tax Brackets
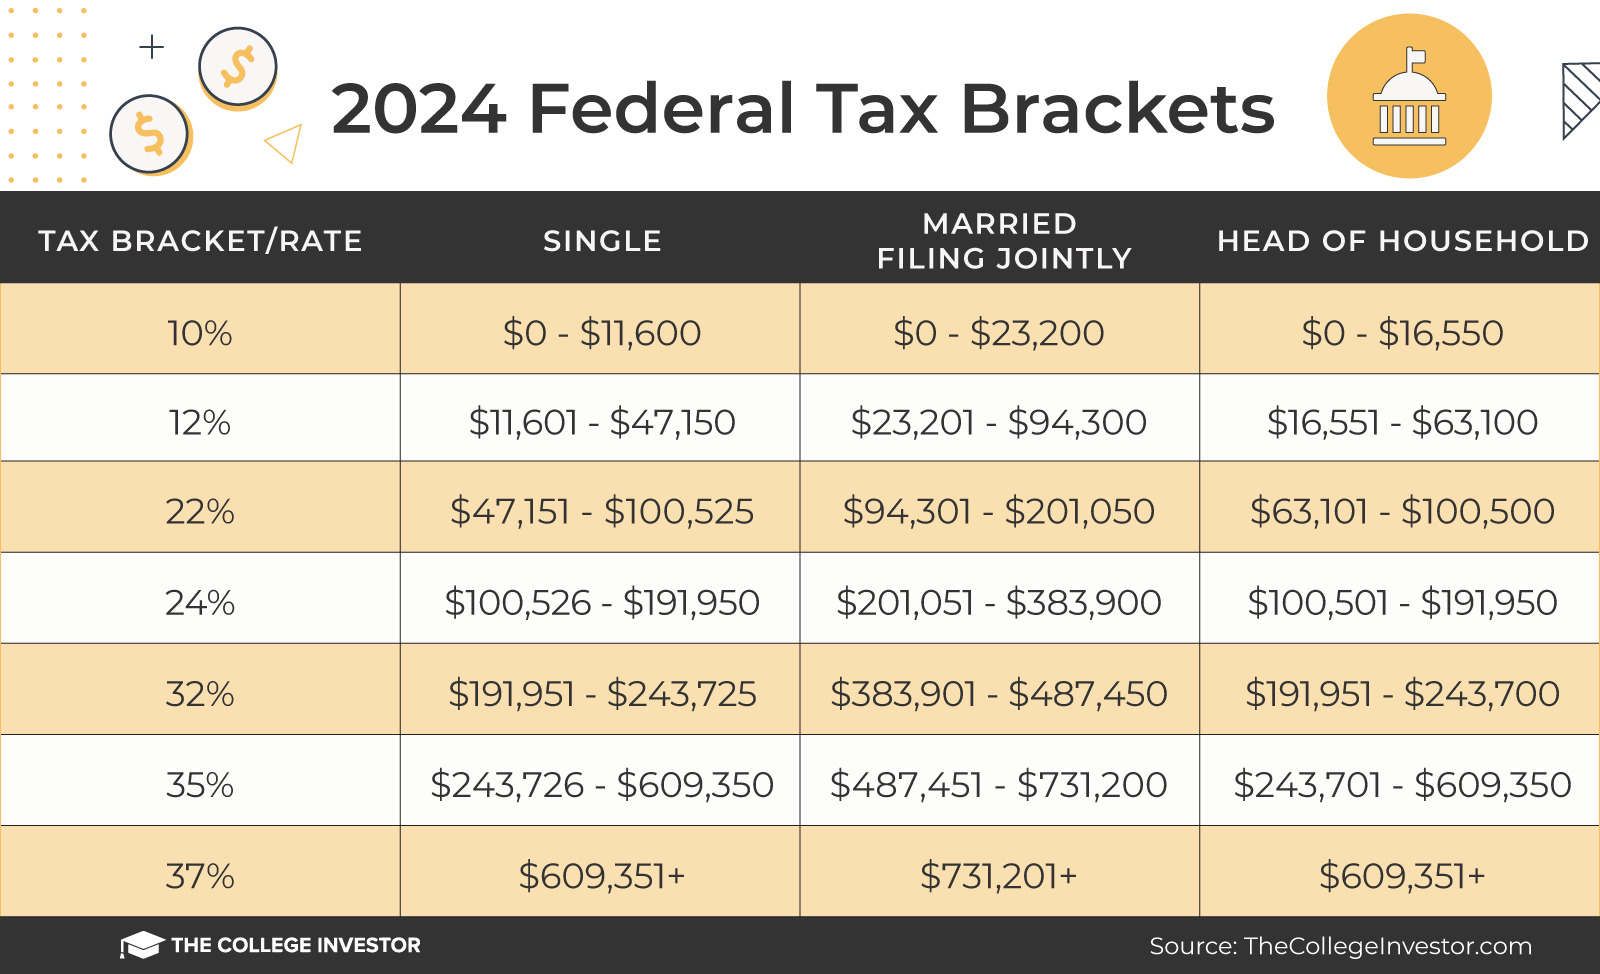
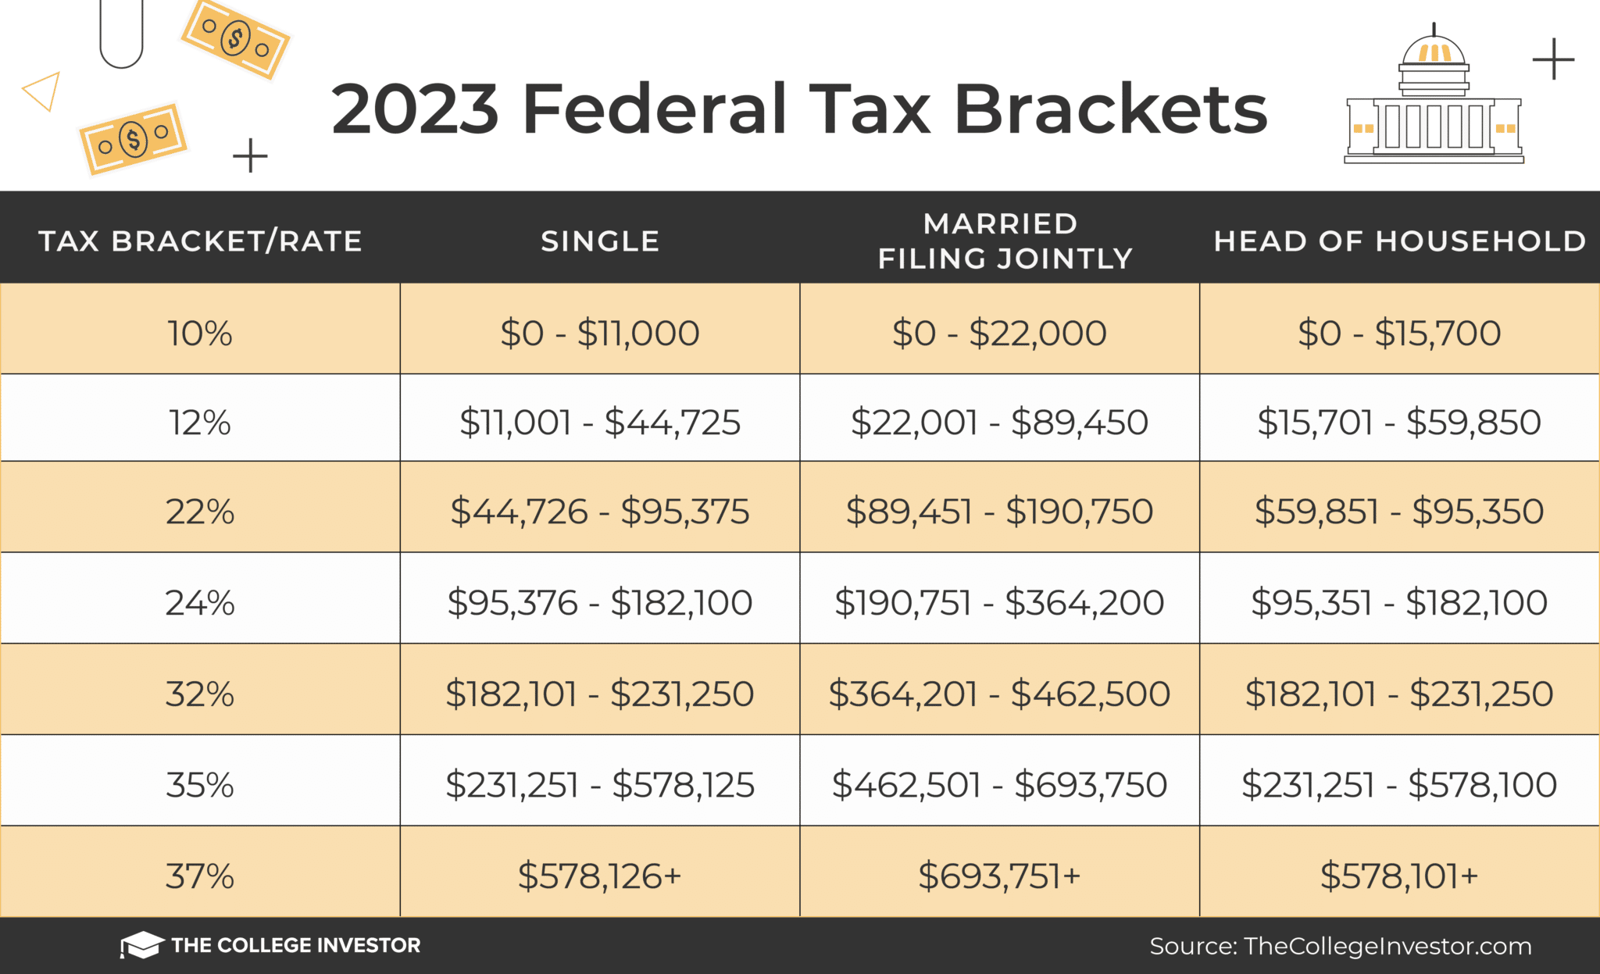
These tables show the federal tax brackets for 2018 through 2025, which you’ll need when amending a prior-year return. Select a year to expand it. Each table applies to taxable income, not total earnings.
2025 Tax Brackets

2024 Tax Brackets
2023 Tax Brackets
2022 Tax Brackets
| Tax Rate | Single | Married Filing Jointly | Head Of Household |
|---|---|---|---|
| 10% | $0 – $10,275 | $0 – $20,550 | $0 – $14,650 |
| 12% | $10,276 – $41,775 | $20,551 – $83,550 | $14,651 – $55,900 |
| 22% | $41,776 – $89,075 | $83,551 – $178,150 | $55,901 – $89,050 |
| 24% | $89,076 – $170,050 | $178,151 – $340,100 | $89,051 – $170,050 |
| 32% | $170,051 – $215,950 | $340,101 – $431,900 | $170,051 – $215,950 |
| 35% | $215,951 – $539,900 | $431,901 – $647,850 | $215,951 – $539,900 |
| 37% | $539,901+ | $647,851+ | $539,901+ |
2021 Tax Brackets
| Tax Rate | Single | Married Filing Jointly | Head Of Household |
|---|---|---|---|
| 10% | $0 – $9,950 | $0 – $19,900 | $0 – $14,200 |
| 12% | $9,951 – $40,525 | $19,901 – $81,050 | $14,201 – $54,200 |
| 22% | $40,526 – $86,375 | $81,051 – $172,750 | $54,201 – $86,350 |
| 24% | $86,376 – $164,925 | $172,751 – $329,850 | $86,351 – $164,900 |
| 32% | $164,926 – $209,425 | $329,851 – $418,850 | $164,901 – $209,400 |
| 35% | $209,426 – $523,600 | $418,851 – $628,300 | $209,401 – $523,600 |
| 37% | $523,601+ | $628,301+ | $523,601+ |
2020 Tax Brackets
| Tax Rate | Single | Married Filing Jointly | Head Of Household |
|---|---|---|---|
| 10% | $0 – $9,875 | $0 – $19,750 | $0 – $14,100 |
| 12% | $9,876 – $40,125 | $19,751 – $80,250 | $14,101 – $53,700 |
| 22% | $40,126 – $85,525 | $80,251 – $171,050 | $53,701 – $85,500 |
| 24% | $85,526 – $163,300 | $171,051 – $326,600 | $85,501 – $163,300 |
| 32% | $163,301 – $207,350 | $326,601 – $414,700 | $163,301 – $207,350 |
| 35% | $207,351 – $518,400 | $414,701 – $622,050 | $207,351 – $518,400 |
| 37% | $518,401+ | $622,051+ | $518,401+ |
2019 Tax Brackets
| Tax Rate | Single | Married Filing Jointly | Head Of Household |
|---|---|---|---|
| 10% | $0 – $9,700 | $0 – $19,400 | $0 – $13,850 |
| 12% | $9,701 – $39,475 | $19,401 – $78,950 | $13,851 – $52,850 |
| 22% | $39,476 – $84,200 | $78,951 – $168,400 | $52,851 – $84,200 |
| 24% | $84,201 – $160,725 | $168,401 – $321,450 | $84,201 – $160,700 |
| 32% | $160,726 – $204,100 | $321,451 – $408,200 | $160,701 – $204,100 |
| 35% | $204,101 – $510,300 | $408,201 – $612,350 | $204,101 – $510,300 |
| 37% | $510,301+ | $612,351+ | $510,301+ |
2018 Tax Brackets
| Tax Rate | Single | Married Filing Jointly | Head Of Household |
|---|---|---|---|
| 10% | $0 – $9,525 | $0 – $19,050 | $0 – $13,600 |
| 12% | $9,526 – $38,700 | $19,051 – $77,400 | $13,601 – $51,800 |
| 22% | $38,701 – $82,500 | $77,401 – $165,000 | $51,801 – $82,500 |
| 24% | $82,501 – $157,500 | $165,001 – $315,000 | $82,501 – $157,500 |
| 32% | $157,501 – $200,000 | $315,001 – $400,000 | $157,501 – $200,000 |
| 35% | $200,001 – $500,000 | $400,001 – $600,000 | $200,001 – $500,000 |
| 37% | $500,001+ | $600,001+ | $500,001+ |
Standard Deduction History (2018 To 2027)
| Year | Single | Married Filing Jointly | Head Of Household |
|---|---|---|---|
| 2027 | $16,600 | $33,200 | $24,925 |
| 2026 | $16,100 | $32,200 | $24,150 |
| 2025 | $15,750 | $31,500 | $23,625 |
| 2024 | $14,600 | $29,200 | $21,900 |
| 2023 | $13,850 | $27,700 | $20,800 |
| 2022 | $12,950 | $25,900 | $19,400 |
| 2021 | $12,550 | $25,100 | $18,800 |
| 2020 | $12,400 | $24,800 | $18,650 |
| 2019 | $12,200 | $24,400 | $18,350 |
| 2018 | $12,000 | $24,000 | $18,000 |
How Do You Calculate Your Withholding?
Your withholding is the federal income tax your employer takes out of each paycheck, based on your Form W-4. The IRS Tax Withholding Estimator compares what you’re having withheld with what you’ll owe. Check it after your first paycheck in January, since 2027 withholding uses the new brackets.
Employers set withholding with IRS Publication 15-T (PDF File), the federal withholding tax table. Federal income tax is only part of your paycheck deductions, since FICA taxes take another 7.65% for Social Security and Medicare, and most states add their own income tax.
Federal Tax Bracket FAQs
When Do The 2027 Tax Brackets Take Effect?
The 2027 brackets take effect January 1, 2027, and apply to income earned through December 31, 2027. You’ll use them on the return you file in early 2028, while this spring’s return still uses the 2026 brackets. Our news story on the IRS release of the 2027 numbers covers the other changes.
Do Tax Brackets Apply To All Of My Income?
No. The brackets apply to taxable income, which is what’s left after deductions. Long-term capital gains and qualified dividends use separate 0%, 15% and 20% rates, and Social Security and Medicare taxes are figured separately.
Did The Federal Tax Rates Change For 2027?
No. The seven rates in the IRS 2027 update stay at 10%, 12%, 22%, 24%, 32%, 35% and 37%, and only the income ranges moved. The 2025 tax law made those rates permanent, so they no longer expire after 2025.
Who Pays The 37% Tax Rate?
In 2027, the 37% rate applies to taxable income above $661,375 for single filers and $793,650 for married couples filing jointly, up from $640,600 and $768,700 in 2026. Only the income above that line is taxed at 37%. Some high earners lower their top-rate income by timing Roth conversions in lower-bracket years.
What Is The Federal Withholding Tax Table?
The federal withholding tax table is IRS Publication 15-T, which employers use to figure how much income tax to take from each paycheck. It’s built from the same brackets and standard deduction as your return. Our explanation of the difference between a W-2 and a W-4 shows how withholding ends up on your year-end tax form.
Editor: Colin Graves Reviewed by: Ohan Kayikchyan Ph.D., CFP®

Get the latest financial news and actionable insights.
How it works:
- 1Enter your email and subscribe.
- 2Get the latest personal finance and education news delivered every week.
- 3Take control of your finances with real insights.
- 4We won't spam you, ever!

Robert Farrington is the founder of The College Investor and is widely recognized as one of the nation’s leading voices on student loan debt and saving for college. He holds an MBA from UC San Diego Rady School of Management and has spent over 15 years researching, writing, and advising on student loans, 529 plans, financial aid programs, and saving and investing for young professionals.
Robert has been featured in the The New York Times, The Wall Street Journal, The Washington Post, NBC News, and Forbes, where he has been a regular personal finance contributor for over a decade. His work combines both professional expertise and personal experience – he successfully navigated his own student loan repayment journey and has helped thousands of readers do the same.
He is committed to making the intersection of personal finance and education transparent and accessible. You can learn more about Robert on the About Page or on his personal site RobertFarrington.com.