There are two capital gains tax categories with different tax brackets - short term and long term.
Long term investments pay less in taxes - these are investments that you typically hold for longer than one year.
Short term investments are taxed at your regular income rate.
Let's break down what the capital gains tax brackets look like, the income cut-offs, and more below. You can see how these compare to the regular Federal tax brackets here.
What Are Capital Gains?
When you sell a stock for a profit, you realize a capital gain. Basically, when most assets are sold for a profit, a capital gain is generated. Profits or gains are taxable. How much you’ll pay depends on a number of factors, including the current tax brackets, which change periodically.
Personal assets and investments are called capital assets. This includes your home, car, investments, recreational vehicle, and more. IRS Topic Number 409 covers these items in more detail. A capital gain or capital loss is based on the difference between the asset sale price and your adjusted basis, which is referenced in IRS Publication 551.
2024 Capital Gains Tax Brackets
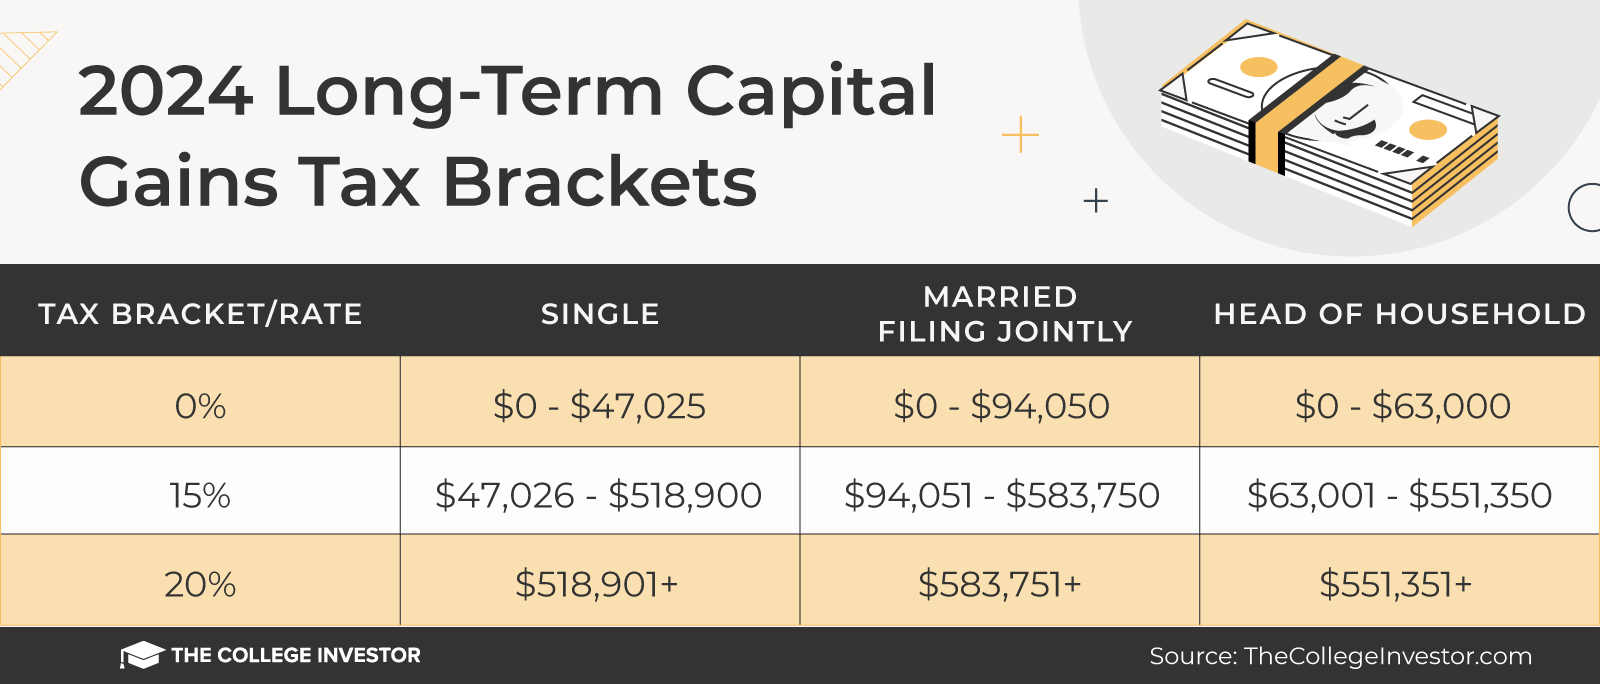
There are two main categories for capital gains: short- and long-term. Short-term capital gains are taxed at your ordinary income tax rate. Long-term capital gains are taxed at only three rates: 0%, 15%, and 20%.
Remember, this isn't for the tax return you file in 2024, but rather, any gains you incur from January 1, 2024 to December 31, 2024. You'll file this tax return in 2025.
The actual rates didn't change for this year, but the income brackets did adjust significantly due to rising inflation.
Short-Term Capital Gains Rates
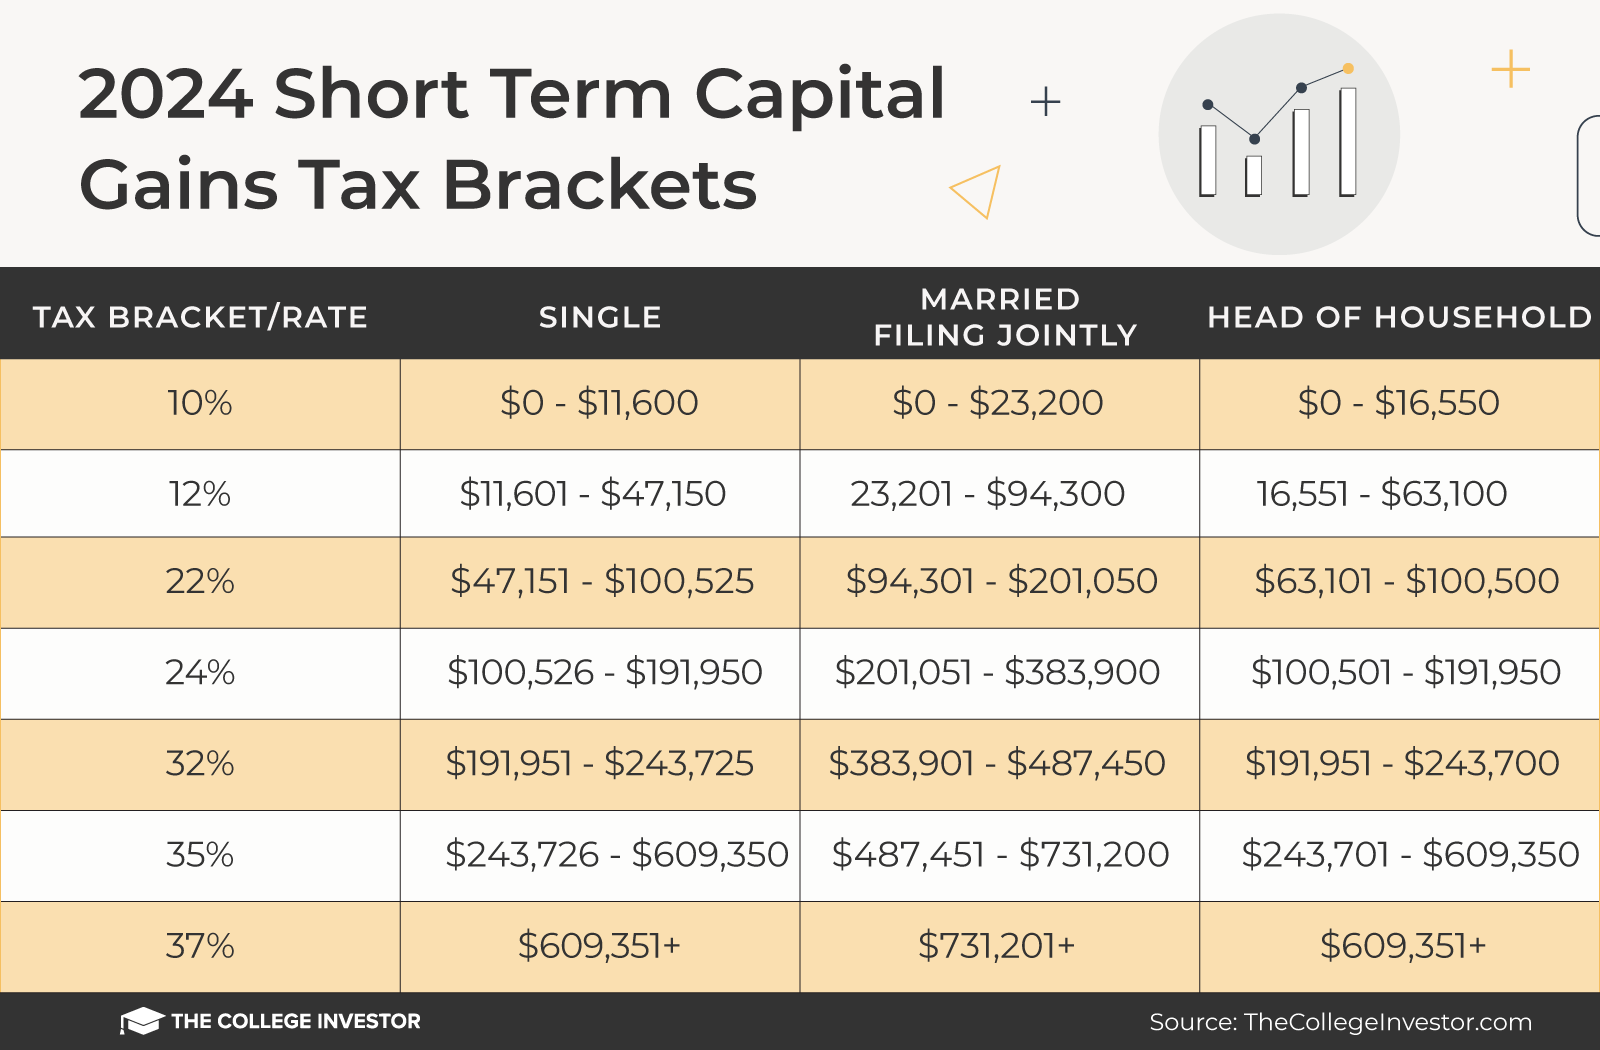
Tax rates for short-term gains are 10%, 12%, 22%, 24%, 32%, 35%, and 37%.
Short-term gains are for assets held for one year or less - this includes short term stock holdings and short term collectibles and crypto.

Long-Term Capital Gains Rates
Just like short-term gains, there are four filing categories: single, married and filing jointly, head of household, and married and filing separately. The amount of taxes paid is based on income.
The brackets adjusted upwards for 2024 due to rising inflation.
Long-term gains are those on assets held for over a year. Below, the percentage of taxes paid are listed on the left with the corresponding income on the right.

Here is a chart for the 2024 Short Term capital gains tax brackets:
2024 Short Term Capital Gains Tax Brackets | |||
|---|---|---|---|
Tax Bracket/Rate | Single | Married Filing Jointly | Head of Household |
10% | $0 - $11,600 | $0 - $23,200 | $0 - $16,550 |
12% | $11,601 - $47,150 | $23,201 - $94,300 | $16,551 - $63,100 |
22% | $47,151 - $100,525 | $94,301 - $201,050 | $63,101 - $100,500 |
24% | $100,526 - $191,950 | $201,051 - $383,900 | $100,501 - $191,950 |
32% | $191,951 - $243,725 | $383,901 - $487,450 | $191,951 - $243,700 |
35% | $243,726 - $609,350 | $487,451 - $731,200 | $243,701 - $609,350 |
37% | $609,351+ | $731,201+ | $609,351+ |
Here is a chart for the 2024 Long Term capital gains tax brackets:
2024 Long Term Capital Gains Tax Brackets | |||
|---|---|---|---|
Tax Bracket/Rate | Single | Married Filing Jointly | Head of Household |
0% | $0 - $47,025 | $0 - $94,050 | $0 - $63,000 |
15% | $47,026 - $518,900 | $94,051 - $583,750 | $63,001 - $551,350 |
20% | $518,901+ | $583,751+ | $551,351+ |
Net Investment Income Tax (Medicare Tax)
The Net Investment Income Tax (NIIT) or Medicare Tax applies at a rate of 3.8% to certain net investment income of individuals, estates and trusts that have income above the statutory threshold amounts.
In general, investment income includes, but is not limited to: interest, dividends, capital gains, rental and royalty income, non-qualified annuities, income from businesses involved in trading of financial instruments or commodities and businesses that are passive activities to the taxpayer
Individuals will owe the tax if they have Net Investment Income and also have modified adjusted gross income over the following thresholds:
2024 Net Investment Income Tax | |
|---|---|
Filing Status | AGI Threshold Amount |
Single | $200,000 |
Married Filing Jointly | $250,000 |
Married Filing Separately | $125,000 |
Head Of Household | $200,000 |
Qualifying Widower with Dependent Child | $250,000 |
Collectible Long Term Capital Gains Rate
Collectibles held over one year are always taxed at 28%.
Collectibles include gold and silver, art work, rare coins, antiques, and more.
2023 Capital Gains Tax Brackets
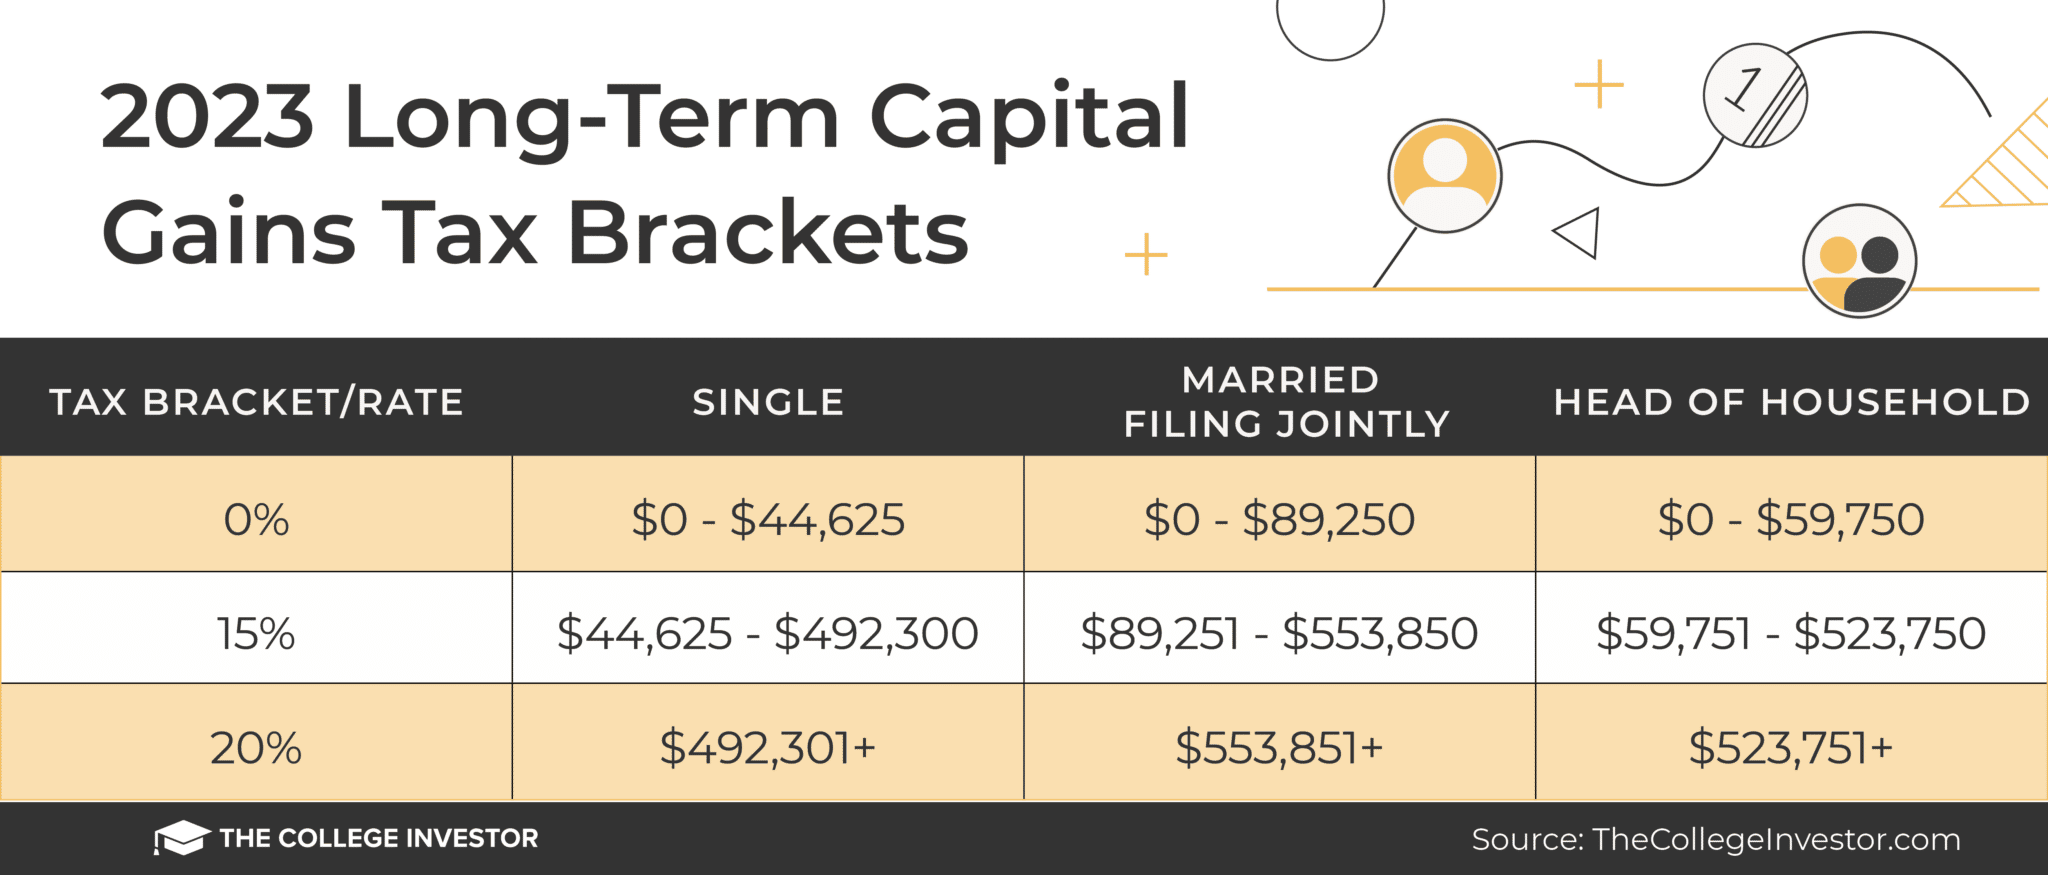
Long-term capital gains are taxed at only three rates: 0%, 15%, and 20%.
Remember, this isn't for the tax return you file in 2023, but rather, any gains you incur from January 1, 2023 to December 31, 2023. You'll file this tax return in 2024.
The actual rates didn't change for this year, but the income brackets did adjust significantly due to rising inflation.
Short-Term Capital Gains Rates
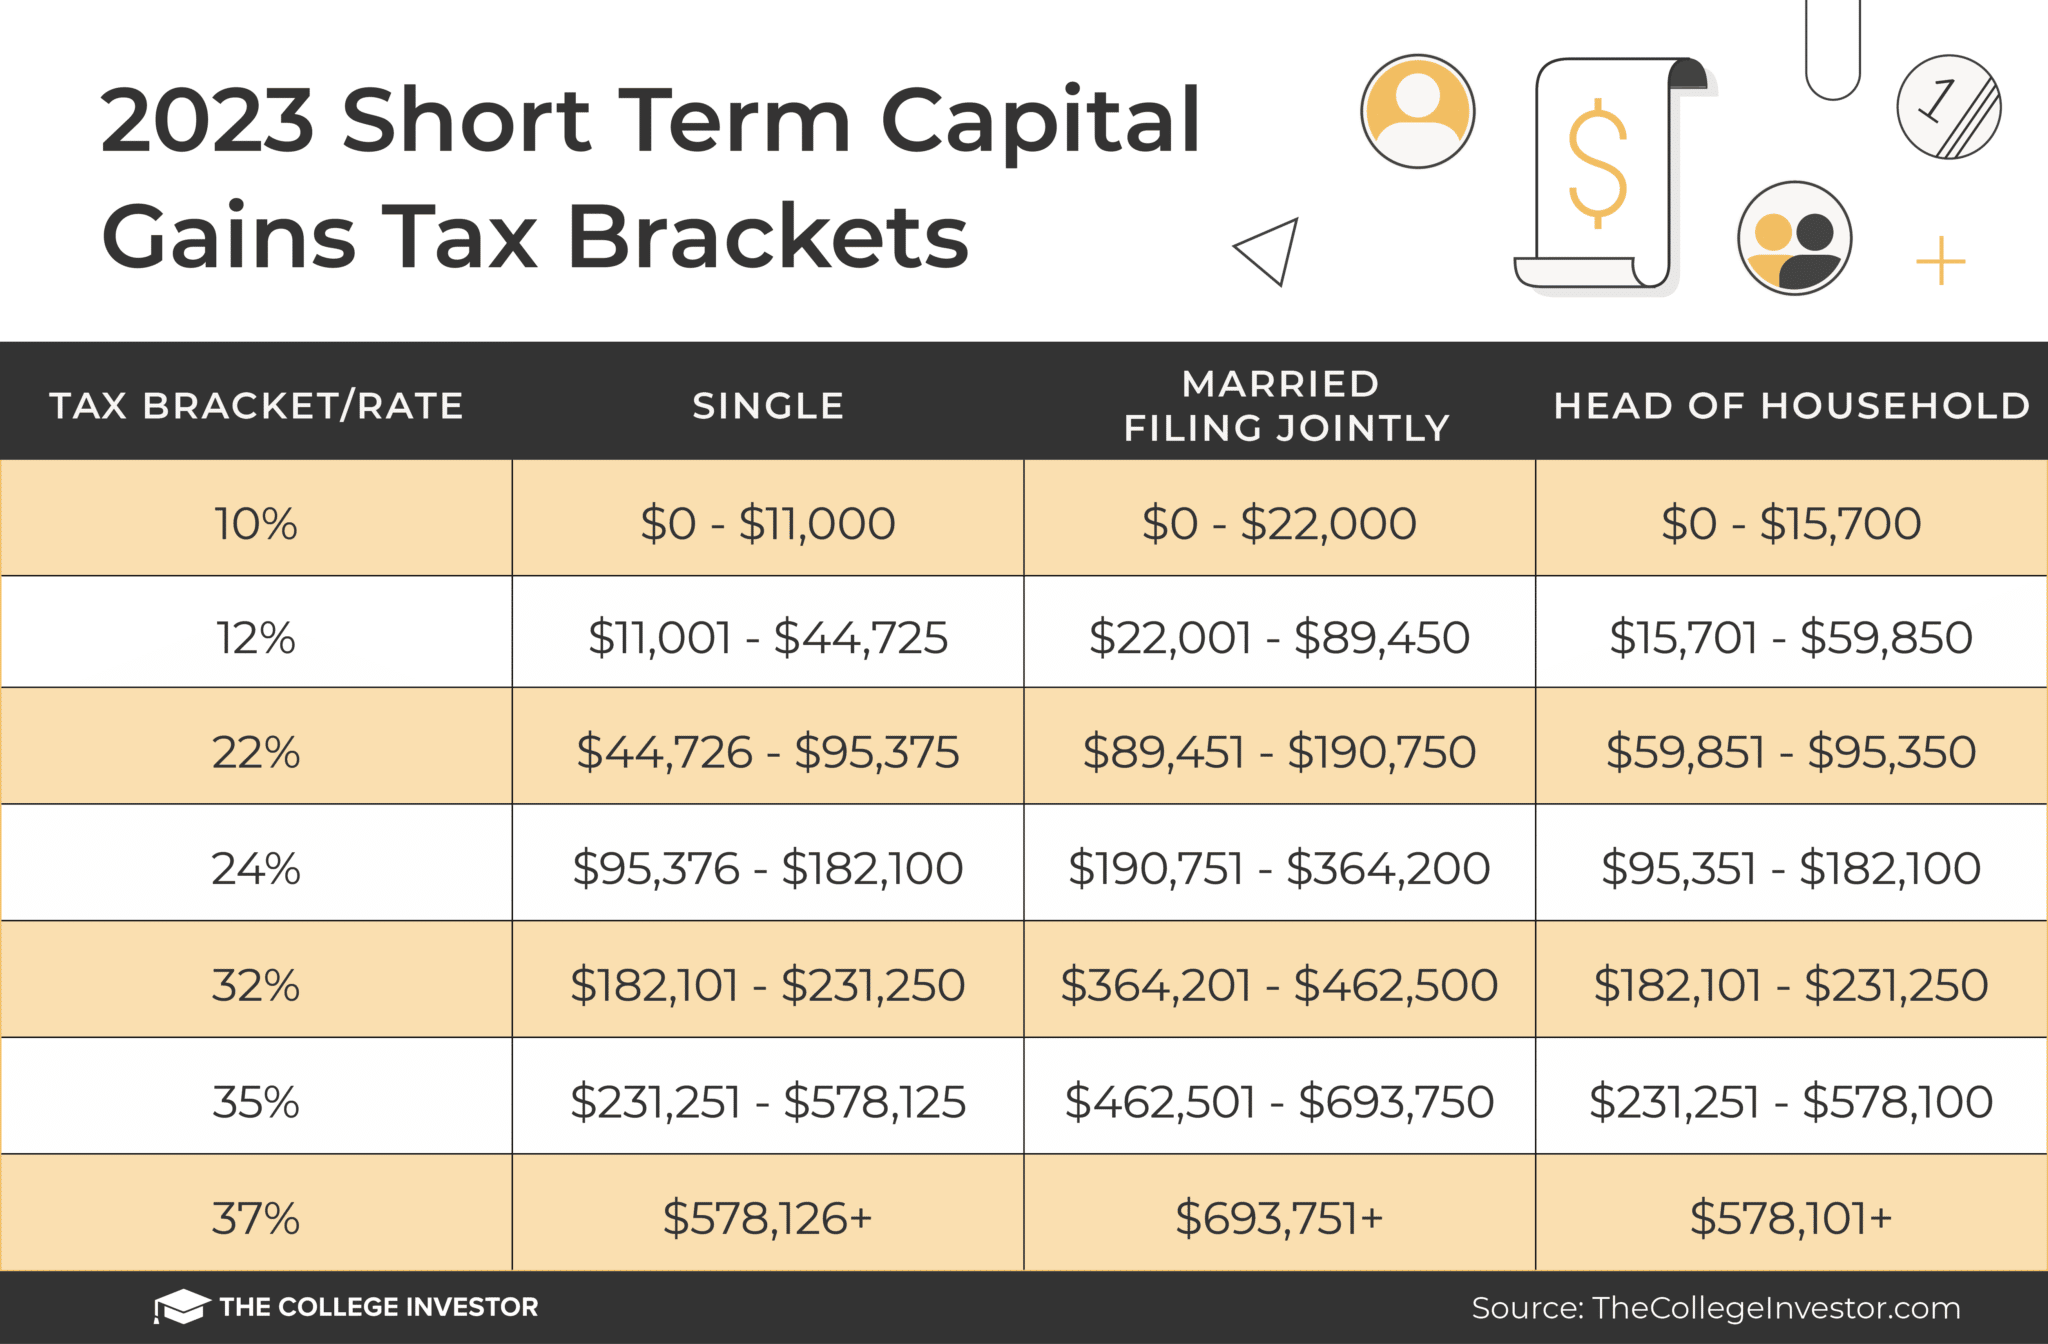
Tax rates for short-term gains are 10%, 12%, 22%, 24%, 32%, 35%, and 37%.
Short-term gains are for assets held for one year or less - this includes short term stock holdings and short term collectibles and crypto.

Long-Term Capital Gains Rates
Just like short-term gains, there are four filing categories: single, married and filing jointly, head of household, and married and filing separately. The amount of taxes paid is based on income.
The brackets adjusted upwards for 2023 due to rising inflation.
Long-term gains are those on assets held for over a year. Below, the percentage of taxes paid are listed on the left with the corresponding income on the right.

Here is a chart for the 2023 Short Term capital gains tax brackets:
2023 Short Term Capital Gains Tax Brackets | |||
|---|---|---|---|
Tax Bracket/Rate | Single | Married Filing Jointly | Head of Household |
10% | $0 - $11,000 | $0 - $22,000 | $0 - $15,700 |
12% | $11,001 - $44,725 | $22,001 - $89,450 | $15,701 - $59,850 |
22% | $44,726 - $95,375 | $89,451 - $190,750 | $59,851 - $95,350 |
24% | $95,376 - $182,100 | $190,751 - $364,200 | $95,351 - $182,100 |
32% | $182,101 - $231,250 | $364,201 - $462,500 | $182,101 - $231,250 |
35% | $231,251 - $578,125 | $462,501 - $693,750 | $231,251 - $578,100 |
37% | $578,126+ | $693,751+ | $578,101+ |
Here is a chart for the 2023 Long Term capital gains tax brackets:
2023 Long Term Capital Gains Tax Brackets | |||
|---|---|---|---|
Tax Bracket/Rate | Single | Married Filing Jointly | Head of Household |
0% | $0 - $44,625 | $0 - $89,250 | $0 - $59,750 |
15% | $44,625 - $492,300 | $89,251 - $553,850 | $59,751 - $523,750 |
20% | $492,301+ | $553,851+ | $523,751+ |
Net Investment Income Tax (Medicare Tax)
The Net Investment Income Tax (NIIT) or Medicare Tax applies at a rate of 3.8% to certain net investment income of individuals, estates and trusts that have income above the statutory threshold amounts.
In general, investment income includes, but is not limited to: interest, dividends, capital gains, rental and royalty income, non-qualified annuities, income from businesses involved in trading of financial instruments or commodities and businesses that are passive activities to the taxpayer
Individuals will owe the tax if they have Net Investment Income and also have modified adjusted gross income over the following thresholds:
2023 Net Investment Income Tax | |
|---|---|
Filing Status | AGI Threshold Amount |
Single | $200,000 |
Married Filing Jointly | $250,000 |
Married Filing Separately | $125,000 |
Head Of Household | $200,000 |
Qualifying Widower with Dependent Child | $250,000 |
Collectible Long Term Capital Gains Rate
Collectibles held over one year are always taxed at 28%.
Collectibles include gold and silver, art work, rare coins, antiques, and more.
2022 Capital Gains Tax Brackets
There are two main categories for capital gains: short- and long-term. Short-term capital gains are taxed at your ordinary income tax rate. Long-term capital gains are taxed at only three rates: 0%, 15%, and 20%.
Remember, this isn't for the tax return you file in 2022, but rather, any gains you incur from January 1, 2022 to December 31, 2022 - and you file that tax return in January 2023.
The actual rates didn't change, but the income brackets did adjust slightly.
Short-Term Capital Gains Rates
Tax rates for short-term gains are 10%, 12%, 22%, 24%, 32%, 35%, and 37%.
Short-term gains are for assets held for one year or less - this includes short term stock holdings and short term collectibles and crypto.
2022 Short Term Capital Gains Tax Brackets | |||
|---|---|---|---|
Tax Bracket/Rate | Single | Married Filing Jointly | Head of Household |
10% | $0 - $10,275 | $0 - $20,550 | $0 - $14,650 |
12% | $10,276 - $41,775 | $20,551 - $83,550 | $14,651 - $55,900 |
22% | $41,776 - $89,075 | $83,551 - $178,150 | $55,901 - $89,050 |
24% | $89,076 - $170,050 | $178,151 - $340,100 | $89,051 - $170,050 |
32% | $170,051 - $215,950 | $340,101 - $431,900 | $170,051 - $215,950 |
35% | $215,951 - $539,900 | $431,901 - $647,850 | $215,951 - $539,900 |
37% | $539,901+ | $647,851+ | $539,901+ |
Long-Term Capital Gains Rates
Just like short-term gains, there are four filing categories: single, married and filing jointly, head of household, and married and filing separately. The amount of taxes paid is based on income.
The brackets adjusted slightly upwards for 2022.
Long-term gains are those on assets held for over a year. Below, the percentage of taxes paid are listed on the left with the corresponding income on the right.
2022 Long Term Capital Gains Tax Brackets | |||
|---|---|---|---|
Tax Bracket/Rate | Single | Married Filing Jointly | Head of Household |
0% | $0 - $41,675 | $0 - $83,350 | $0 - $55,800 |
15% | $40,676 - $459,750 | $83,351 - $517,200 | $55,801 - $488,500 |
20% | $459,751+ | $517,201+ | $488,501+ |
Net Investment Income Tax (Medicare Tax)
The Net Investment Income Tax (NIIT) or Medicare Tax applies at a rate of 3.8% to certain net investment income of individuals, estates and trusts that have income above the statutory threshold amounts.
In general, investment income includes, but is not limited to: interest, dividends, capital gains, rental and royalty income, non-qualified annuities, income from businesses involved in trading of financial instruments or commodities and businesses that are passive activities to the taxpayer
Individuals will owe the tax if they have Net Investment Income and also have modified adjusted gross income over the following thresholds:
2022 Net Investment Income Tax | |
|---|---|
Filing Status | AGI Threshold Amount |
Single | $200,000 |
Married Filing Jointly | $250,000 |
Married Filing Separately | $125,000 |
Head Of Household | $200,000 |
Qualifying Widower with Dependent Child | $250,000 |
Collectible Long Term Capital Gains Rate
Collectibles held over one year are always taxed at 28%.
Collectibles include gold and silver, art work, rare coins, antiques, and more.
Prior Years Capital Gains Tax Brackets And Rates
Are you looking for capital gains tax brackets for prior years? Check out the drop down list below, find your year, and you can see the brackets:
Here are the 2021 capital gains tax brackets. The rates didn't change from 2020, but the income brackets did adjust slightly.
Here are the short term capital gains brackets:
2021 Short Term Capital Gains Tax Brackets | |||
|---|---|---|---|
Tax Bracket/Rate | Single | Married Filing Jointly | Head of Household |
10% | $0 - $9,950 | $0 - $19,900 | $0 - $14,200 |
12% | $9,951 - $40,525 | $19,901 - $81,050 | $14,201 - $54,200 |
22% | $40,526 - $86,375 | $81,051 - $172,750 | $54,201 - $86,350 |
24% | $86,376 - $164,925 | $172,751 - $329,850 | $86,351 - $164,900 |
32% | $164,926 - $209,425 | $329,851 - $418,850 | $164,901 - $209,400 |
35% | $209,426 - $523,600 | $418,851 - $628,300 | $209,401 - $523,600 |
37% | $523,601+ | $628,301+ | $523,601+ |
Here are the long term capital gains tax brackets:
2021 Long Term Capital Gains Tax Brackets | |||
|---|---|---|---|
Tax Bracket/Rate | Single | Married Filing Jointly | Head of Household |
0% | $0 - $40,400 | $0 - $80,800 | $0 - $54,100 |
15% | $40,401 - $445,850 | $80,801 - $501,600 | $54,101 - $473,750 |
20% | $445,851+ | $501,601+ | $473,751+ |
Here are the 2020 capital gains tax rates. The actual rates didn't change this year, but the income brackets did adjust slightly.
Here are the short term capital gains tax rates:
2020 Short Term Capital Gains Tax Brackets | |||
|---|---|---|---|
Tax Bracket/Rate | Single | Married Filing Jointly | Head of Household |
10% | $0 - $9,875 | $0 - $19,750 | $0 - $14,100 |
12% | $9,876 - $40,125 | $19,751 - $80,250 | $14,101 - $53,700 |
22% | $40,126 - $85,525 | $80,251 - $171,050 | $53,701 - $85,500 |
24% | $85,526 - $163,300 | $171,051 - $326,600 | $85,501 - $163,300 |
32% | $163,301 - $207,350 | $326,601 - $414,700 | $163,301 - $207,350 |
35% | $207,351 - $518,400 | $414,701 - $622,050 | $207,351 - $518,400 |
37% | $518,401+ | $622,051+ | $518,401+ |
Here are the long term capital gains rates and brackets:
2020 Long Term Capital Gains Tax Brackets | |||
|---|---|---|---|
Tax Bracket/Rate | Single | Married Filing Jointly | Head of Household |
0% | $0 - $40,000 | $0 - $80,000 | $0 - $53,600 |
15% | $40,001 - $441,450 | $80,001 - $496,600 | $53,601 - $469,050 |
20% | $441,451+ | $496,601+ | $469,051+ |
Here are the 2019 capital gains tax rates.
Here are the short term capital gains tax brackets:
2019 Short Term Capital Gains Tax Brackets | |||
|---|---|---|---|
Tax Bracket/Rate | Single | Married Filing Jointly | Head of Household |
10% | $0 - $9,700 | $0 - $19,400 | $0 - $13,850 |
12% | $9,701 - $39,475 | $19,401 - $78,950 | $13,851 - $52,850 |
22% | $39,476 - $84,200 | $78,951 - $168,400 | $52,851 - $84,200 |
24% | $84,201 - $160,725 | $168,401 - $321,450 | $84,201 - $160,700 |
32% | $160,726 - $204,100 | $321,451 - $408,200 | $160,701 - $204,100 |
35% | $204,101 - $510,300 | $408,201 - $612,350 | $204,101 - $510,300 |
37% | $510,301+ | $612,351+ | $510,301+ |
Here are the 2019 long term capital gains tax brackets:
2019 Long Term Capital Gains Tax Brackets | |||
|---|---|---|---|
Tax Bracket/Rate | Single | Married Filing Jointly | Head of Household |
0% | $0 - $39,375 | $0 - $78,750 | $0 - $52,750 |
15% | $39,376 - $434,550 | $78,751 - $488,850 | $52,751 - $461,700 |
20% | $434,551+ | $488,851+ | $461,701+ |
Calculating Capital Gains and Losses
While you can have a capital gain from the profitable sale of an asset, you can also have a capital loss from the sale of an asset below your purchase price or adjusted basis.
As an example, say you buy and sell stock in the same year up to November. Your trading has netted $10,000 in profits. These profits are classified as short-term gains because they’re less than a year old. Then in December of the same year, you sell more stock for a loss of $3,000. Your capital gain is reduced to $7,000.
A different investor buys and sells some stock during a year and manages to lose $5,000. This investor has a capital loss of $5,000 but can only declare $3,000 ($1,500 if married filing separately) for the current year. What happens to the remaining $2,000?
The $2,000 capital loss in the previous example is carried over to the next year. It can be applied as a capital loss. Using another example, our investor has a capital gain of $10,000 in the next year. They can offset this gain and reduce their taxes by the amount carried over from the previous year: $2,000. Their new capital gain is then $8,000.
With capital gains, your capital gain is stacked on top of other ordinary income before the bracket and rate is calculated. This does leave some planning opportunity to try and minimize the taxes paid, but given the 0% bracket is relatively low, it likely means your gains will extend into other brackets.
While at the marginal level, capital gains are flat taxed - in practice, your gain can be subject to different tax rates depending on the amount of the gain. You can see this in the tax brackets section above. If you are single and make a $45,000 capital gain on top of your $40,000 in ordinary income, your long-term capital gains tax bracket is 15%. You will then pay $6,750 ($45,000 x 0.15) in taxes on this gain.
However, if you're single, and have no other income other than your $45,000 capital gain, your first $40,000 would be in the 0% bracket, and the remaining $5,000 would be taxed at 15%.
How to Reduce Your Taxes
Nobody likes paying taxes and everyone is looking for ways to reduce them. There are a few ways that you can reduce your capital gains taxes.
Keeping Investments for at Least a Year
If you hold investments for at least a year before selling, you’ll be able to take advantage of long-term gains.
Use a Robo-Advisor
Robo-advisors have become very popular. While they haven’t yet replaced financial advisors, for most people, they can help save on taxes.
Robo-advisors use a method called tax-loss harvesting. By selling losers, gains on winners are offset. Of course, you can perform tax-loss harvesting manually. However, robo-advisors make this task easy through the use of automation.
It seems there is nowhere to hide from taxes. But arming yourself with knowledge about capital gains taxes can help you save money. We’ve already seen a few practical tips. Your accountant is likely to have more. Ask your accountant questions throughout the year so you can set yourself up for maximizing capital gains tax reductions.

Robert Farrington is America’s Millennial Money Expert® and America’s Student Loan Debt Expert™, and the founder of The College Investor, a personal finance site dedicated to helping millennials escape student loan debt to start investing and building wealth for the future. You can learn more about him on the About Page or on his personal site RobertFarrington.com.
He regularly writes about investing, student loan debt, and general personal finance topics geared toward anyone wanting to earn more, get out of debt, and start building wealth for the future.
He has been quoted in major publications, including the New York Times, Wall Street Journal, Washington Post, ABC, NBC, Today, and more. He is also a regular contributor to Forbes.
Editor: Ashley Barnett Reviewed by: Ohan Kayikchyan Ph.D., CFP®